
Precision Auto Components Group
Unified BI platform connecting 4 manufacturing plants to one analytics layer.
All case studiesA multinational precision components manufacturer operating 12 plants across 4 countries — India, Thailand, Germany, and Mexico — engaged Cydez Technologies to build a unified business intelligence platform. The group ran 8 separate ERP instances (a mix of SAP, Oracle, and proprietary systems) across its plants, with no consolidated view of production output, quality metrics, inventory levels, maintenance schedules, or energy consumption.
Monthly MIS reports were manually assembled by a team of 6 analysts who spent 8 days each month collecting Excel exports from plant controllers, reconciling data formats, and building PowerPoint presentations for the board. By the time reports reached the CEO, they were already 2 weeks old. Real-time visibility into shop floor performance was non-existent at the corporate level.
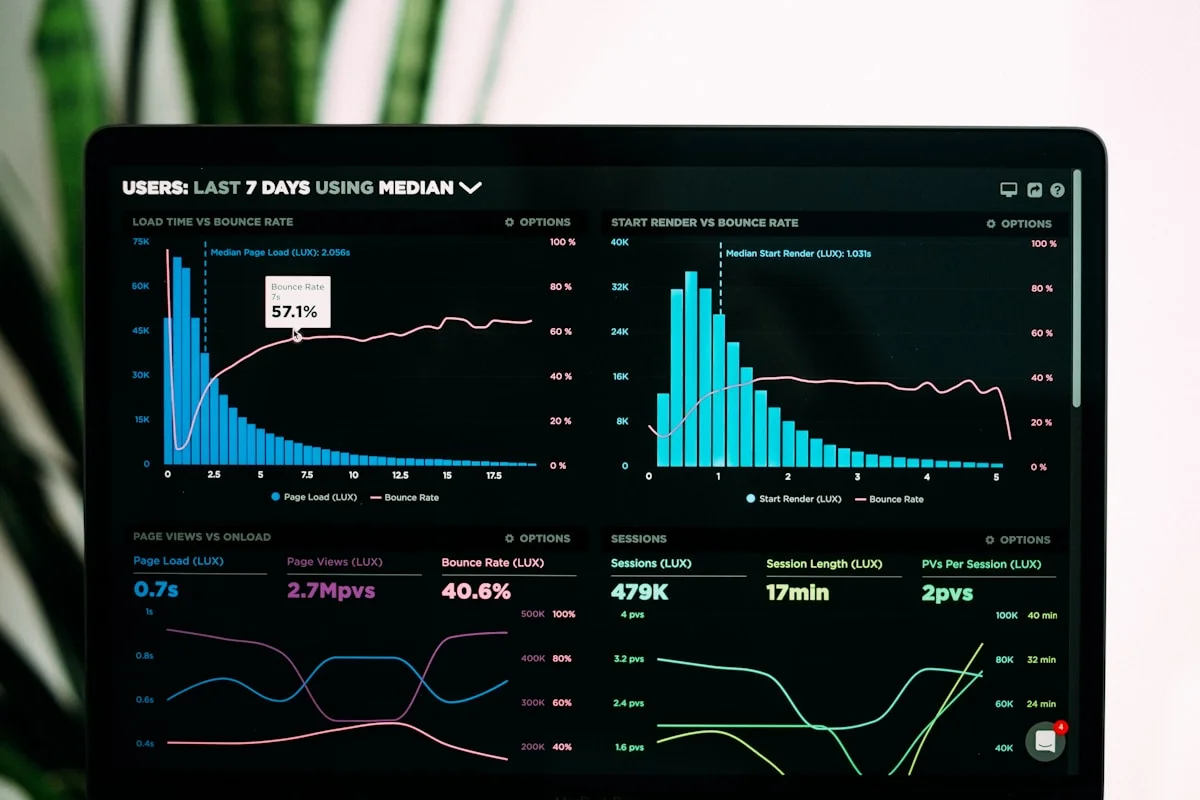
Cydez deployed Oracle Analytics Cloud with a unified semantic layer connecting all 8 ERP instances via MuleSoft integration. The platform delivered real-time dashboards covering production OEE (Overall Equipment Effectiveness), quality defect rates by product line and machine, inventory aging and turnover, maintenance compliance and predictive alerts, and energy consumption per unit of output. Shop floor displays were installed at each plant showing real-time production targets vs. actuals. The platform supported Arabic and English for the Middle East plant stakeholders, with currency and unit-of-measure normalization across 4 countries.
- Unified BI across 12 plants in 4 countries
- 8 ERP instance integration via MuleSoft
- Real-time OEE and quality dashboards
- Shop floor display systems
- Arabic/English bilingual dashboards
- Multi-currency and UoM normalization
A precision auto components manufacturer operated four plants across two states, each running independent ERP instances. Management had no consolidated view of production output, quality metrics, inventory levels, or maintenance schedules. Monthly MIS reports were manually assembled from Excel exports.
Cydez deployed Oracle Analytics Cloud with a semantic layer connecting all four plant ERP systems via MuleSoft. Dashboards covered production OEE, quality defect rates, inventory aging, maintenance compliance, and energy consumption. Shop floor displays showed real-time production targets vs. actuals. FAW pre-built analytics accelerated time to value.

How we delivered this project
Discovery
Visited all 12 plants across 4 countries over 8 weeks. Mapped data structures across 8 ERP instances, documented KPI definitions (which varied by plant), and aligned the executive team on a unified metric framework. Identified 156 data entities required for consolidation.
Design
Designed the OAC semantic layer with unified KPI definitions. Created the MuleSoft integration architecture connecting 8 ERP instances. Designed 45 dashboard layouts for executive, plant manager, and shop floor audiences. Defined the shop floor display specifications.
Development
Built MuleSoft integration flows for all 8 ERP instances with data normalization for currency, UoM, and time zones. Deployed OAC with FAW pre-built analytics. Configured 45 dashboards with drill-down from corporate to plant to machine level. Installed shop floor display hardware.
Launch
Rolled out in 3 waves by region: India (4 plants), Southeast Asia and Middle East (4 plants), and Europe and Americas (4 plants). Trained 120 managers and analysts. Achieved same-day MIS reporting within 60 days of full deployment.
What we built
Production OEE Dashboards
Real-time Overall Equipment Effectiveness monitoring at machine, line, plant, and corporate levels. Automated downtime classification and Pareto analysis for availability, performance, and quality losses.
Quality Analytics
Defect rate tracking by product line, machine, shift, and operator. Statistical process control charts with automated out-of-control alerts. Root cause analysis drill-downs with Ishikawa diagram integration.
Shop Floor Displays
Large-format displays at each plant showing real-time production targets vs. actuals, quality metrics, and safety indicators. Automatic escalation alerts for missed targets.
Inventory Intelligence
Real-time inventory visibility across 12 plants with aging analysis, turnover metrics, and reorder point alerts. Inter-plant transfer optimization recommendations.
Maintenance Compliance
Preventive maintenance schedule tracking with compliance dashboards. Predictive maintenance alerts based on equipment runtime and vibration data trends.
Energy Monitoring
Energy consumption per unit of output tracked at machine and plant level. Benchmarking across plants with efficiency improvement recommendations. Carbon footprint reporting.
Measurable outcomes
- Consolidated reporting across 4 plants delivered in real time
- 25% improvement in OEE within 6 months of dashboard adoption
- Monthly MIS preparation time reduced from 8 days to same-day
- Quality defect rate reduced by 18% through visibility-driven root cause analysis
Built with
Want similar results?
Tell us about your project and we'll explore how Cydez can deliver comparable outcomes for your organisation.
Start a Conversation